

The State of the North American Airline Industry
By ALPA Economic & Financial Analysis Department Staff
Note: The data used in this article do not reflect the impact of Hurricanes Harvey and Irma on the financial performance of the airlines nor the impact to fuel prices going forward. In addition, as this issue went to press, Frontier Airlines had not yet released data for the second quarter, so the airline isn’t included in the industry results.
Amidst rising fuel prices and higher labor costs, North American passenger airlines’ overall profitability declined in the first half of this year. While publicly traded U.S. passenger airlines earned nearly $9.7 billion in pretax profits through the first half of 2017, this was down from the almost $12.3 billion earned over the same time last year. However, perhaps the most notable event this year is that, for the first time since the December quarter of 2014, U.S. carriers experienced a year-over-year improvement in PRASM (passenger revenue per available seat mile) in the second quarter of this year.
U.S. economic indicators remain strong
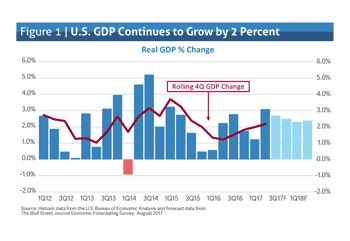
While real gross domestic product (GDP) in the first quarter of this year grew only 1.2 percent, the U.S. economy rebounded in the second quarter and registered a 3.1 percent annualized growth rate (see Figure 1).
Consumer spending, which accounts for about 70 percent of the economy, grew 3.3 percent in the second quarter, after increasing 1.9 percent in the first quarter.
The U.S. economy just recorded its 97th month of growth since the Great Recession, making it the third-longest economic expansion in U.S. history—behind the tech boom of the 1990s (120 months) and the growth experienced in the 1960s (106 months).
During the next two years, the U.S. economy is projected to grow at a similar rate to what has been seen over the past several years, with the International Monetary Fund (IMF) forecasting GDP growth of 2.1 percent in 2017 and 2018.
The unemployment rate continues to fall. Unemployment stood at 4.7 percent at the end of 2016 and as of the end of August had declined to 4.4 percent.
Through August, the economy added 1.4 million jobs, somewhat less than the 1.55 million jobs added over the same time in 2016. While wages have started to rise, the pace of wage growth is still low. Through the first eight months of this year, hourly wages were up about 2.6 percent compared to the first eight months of last year.
Many economists, including members of the Federal Reserve, believe that a healthy rate of growth for wages should be between 3 percent and 3.5 percent a year.
Due to consumers’ more favorable outlook for their own personal financial prospects, the consumer sentiment for the first eight months of this year was higher than in any year since 2000, which was the peak year of the longest economic expansion in U.S. history. Overall, the data point to gains of 2.4 percent in real consumer expenditures during 2017.
Global economic activity accelerates
After a lackluster 2016, the expected pickup in economic activity remains largely on track. According to the Organization for Economic Cooperation and Development (OECD), all 45 countries tracked by the OECD are projected to grow. This will be the first time since 2007 that all are growing at the same time.
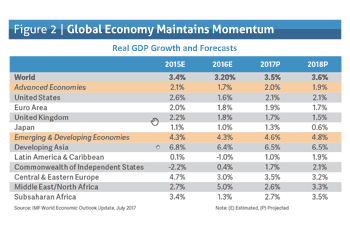
The IMF is projecting global GDP to grow 3.5 percent this year and 3.6 percent in 2018 (see Figure 2). While the overall forecast has not changed from earlier this year, the unchanged global growth projections mask somewhat different contributions at the individual country level.
U.S. growth projections were revised downward, primarily reflecting the assumption that fiscal policy will be less expansionary than previously anticipated. Growth has been revised upward for Japan and especially the euro area, where positive economic activity in late 2016 and early 2017 showed solid momentum. China’s growth projections have also been revised upward, reflecting strong first quarter 2017 growth and expectations of continued fiscal support.
The risk factors affecting economic projections remain skewed downward in the medium term. The combination of rich market valuations and high governmental policy uncertainty raise the likelihood of a market correction, which could dampen growth and confidence. China’s reliance on economic growth through increased credit comes with rising downside risks to medium-term growth. In addition, threats of a turn toward inward-looking policies could limit global trade and reduce demand for business travel. And geopolitical risks continue to remain salient downside risk factors.
Jet fuel prices increase
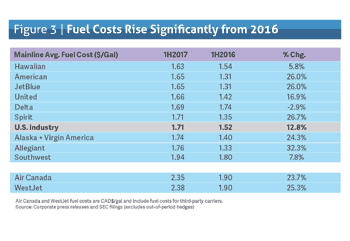
For the first half of the year, publicly traded U.S. passenger airlines saw their fuel bill increase $1.9 billion from last year. While some of this increase is due to a 3.4 percent higher use of fuel, the bulk of the increase can be attributed to higher jet fuel prices. Compared to the first half of 2016, the average price per gallon of jet fuel rose $0.19 (see Figure 3).
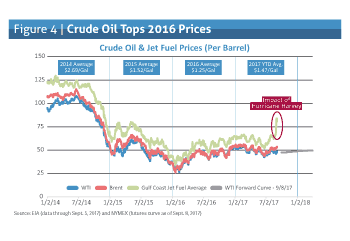
As of early September, the year-to-date price of a barrel of West Texas Intermediate (WTI) crude oil was $49.22, compared to $40.90 for the same period last year. Meanwhile, the year-to-date average price of jet fuel was $1.47 compared to the average price of $1.18 seen over the same period last year (see Figure 4).
While jet fuel prices have been relatively stable this year, Hurricane Harvey substantially disrupted the supply chain and caused a spike in fuel prices. Just more than half of all U.S. refinery capacity is located in the U.S. Gulf Coast, with Texas, where Harvey made landfall, representing 31 percent of all U.S. refinery capacity. Output from Gulf Coast refineries fell 34 percent for the week ending September 1, compared to the prior week. Coupled with the effects of Hurricanes Irma and Maria, it may take several weeks to assess the full impact of these weather events on fuel prices. However, while the price of jet fuel has spiked, the futures market for crude oil remains relatively steady.
U.S. mainline passenger airlines earn pretax profit
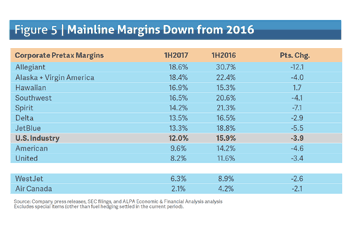
While pretax profits through the first two quarters of 2017 were down $2.6 billion from last year, the industry still posted a very respectable 12.0 percent margin, down from the 15.9 percent pretax margin generated in the first half of 2016 (see Figure 5). Airlines generated more than $80 billion in revenue, a 4.2 percent increase compared to last year.
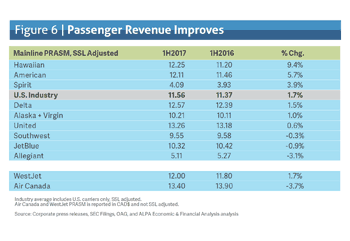
For the first time since the December quarter of 2014, PRASM (passenger revenue per available seat mile) had a year-over-year improvement in the second quarter of this year. Prior to that, consolidated PRASM had fallen for nine straight quarters, with the low point coming in the first quarter of 2016.
The U.S. domestic market PRASM started turning the corner in the first quarter of 2017, and the second quarter saw all carriers report positive PRASM trends, with overall first half industry PRASM up 1.7 percent (see Figure 6). The transatlantic market saw improvements, primarily due to strong business-class demand, but remains challenged by high industry capacity levels. The Latin market continues its strong rebound, having now posted four straight quarters of PRASM improvement. The transpacific market, like the transatlantic market, continues to be hampered by increases in industry capacity, which is offsetting some of the improvements seen in front-cabin demand.
CASM (costs per ASM), excluding fuel, increased 5.0 percent in the first half of 2017. One source of this cost increase came from the 20 new labor agreements that were negotiated in 2016.
Through the second quarter of 2017, mainline carriers increased capacity, as measured by ASMs, by 2.8 percent. For full-year 2017, it’s estimated that U.S. industry systemwide capacity growth will grow 3.1 percent. Overall domestic capacity (mainline, low-cost carriers, and others) is forecast to grow 3.6 percent, while international capacity is expected to grow 2.1 percent.
Canadian carriers continue to elevate capacity growth
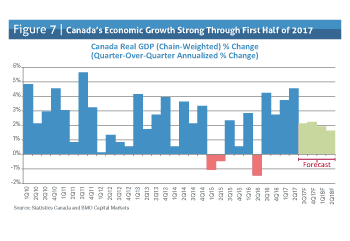
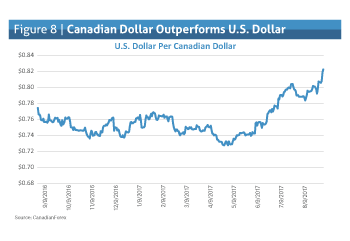
Among all the advanced economies, Canada has made the biggest gains in real GDP growth in the past year. Canadian GDP grew 4.5 percent in the second quarter of 2017, which was the largest gain since the third quarter of 2011, while the 3.7 percent year-over-year increase in GDP was the best in 11 years (see Figure 7). The Canadian economy is supported by rising consumer confidence, some stability in the energy industry, and a rebounding jobs market. The Canadian economy has created the most new jobs in nine years and lowered the unemployment rate to a near-decade low of 6.3 percent. In addition, the oil and gas sector has rebounded, with oil sands output reaching record highs and fully recovering from the impact of the wildfires in Alberta last year. Reflecting the relative strength of Canada’s economy and recent rate hikes from the Bank of Canada, the Canadian dollar has been the best performing currency among the major currencies in the past several months (see Figure 8).
Business activity within Canada continues to gain momentum, lifted by indications that foreign and domestic demand will further improve, although risks from potential U.S. policy changes distort the outlook. The threat of protectionist measures by the U.S. administration poses one of the biggest risks to the Canadian economy. As part of the North American Free Trade Agreement negotiations, the U.S. administration has already targeted Canada’s lumber, steel, dairy, and aerospace industries for concessions.
Despite the risk of a possible reduction in passenger traffic stemming from more protectionist trade policies, Canadian carriers continue to generate high levels of capacity growth. Capacity continues to grow at a faster pace than the GDP, with scheduled capacity growth projected to be 12.7 percent for Air Canada and 5.1 percent for WestJet in 2017. Air Canada’s capacity growth is primarily due to scaling up its Pacific flying, while WestJet’s capacity growth is attributable to domestic growth from WestJet Encore services and its expanding charter business.
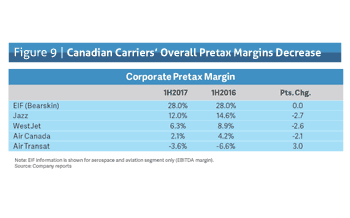
Many Canadian carriers continue to record significant operating revenues due to high traffic demand in the transborder and international markets. Air Canada, WestJet, and Jazz Aviation posted pretax margins of 2.1 percent, 6.3 percent, and 12.0 percent, respectively, for the first half of 2017. Margins were slightly down compared to the first half of 2016 due to increased costs (see Figure 9). Air Canada and WestJet were impacted by higher costs resulting from increased flying and fleet expansion. Jazz was impacted by higher aircraft rent due to additional aircraft leased from Air Canada.
Improvements in the Canadian economy this year will benefit passenger traffic and help to absorb some of the incremental supply. Additionally, the surge in the Canadian dollar will help reduce airline costs that are incurred in U.S. dollars. Yet despite the stronger than expected economic growth in the first half of 2017 and the strong Canadian dollar, the elevated capacity growth at the large Canadian carriers will continue to put pressure on unit revenues, causing industry margins to trend downward.
Cargo industry shows robust growth
After several years of struggling, the air freight sector bounced back last year, with freight ton kilometers (FTKs) growing 3.8 percent in 2016, as global economic conditions started improving beginning in mid-2016. Freight movement experienced gains through an increase in consumer spending growth and strengthening trade, especially in emerging economies.
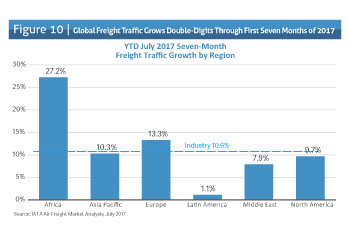
The momentum has continued into 2017, with several months having double-digit FTK growth (see Figure 10). Through July, FTKs grew 10.6 percent compared to the same seven-month period in 2016, with European and Asian carriers accounting for more than two thirds of the growth. FTK growth this year has far surpassed the post 2008–2009 global financial crisis average of 3.0 percent growth and has even surpassed the pre-crisis trade volume growth of 5–7 percent. Positive growth was recorded in all geographic regions.
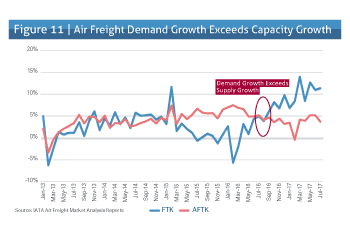
This robust growth in air cargo demand is consistent with an improvement in global trade, rising export orders, and positive business-confidence indicators. These freight volumes have been consistent with the typical pattern seen during upturns in the economic cycle. Beginning in the second half of 2016, demand growth has exceeded capacity growth (see Figure 11).
Yields, including fuel and other surcharges, have risen by 4.5 percent in seasonally adjusted terms since bottoming out in mid-2016. However, when adjusted for inflation, the 2017 annual estimated rate paid for freight is still 69 percent less than the rates paid when compared to 1996 freight rates.
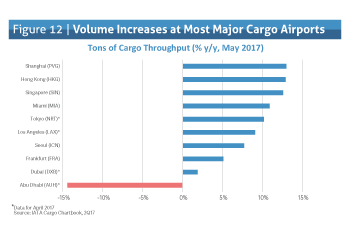
A number of key freight airports saw significant changes to cargo throughput (see Figure 12). This growth in volume has been particularly driven by outbound traffic from Asia. Demand, in general, has been healthy on all of the major routes to, from, and within the Asia Pacific region. Consistent with figures from earlier in the year, most major Asian cargo airports saw double-digit rate increases in May. Meanwhile, conditions in the Middle East remain soft, with Dubai only recording modest increases and Abu Dhabi seeing significant drops in cargo throughput.
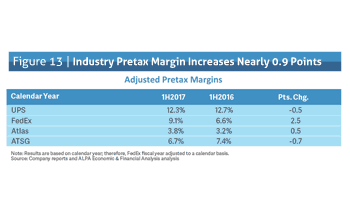
U.S. publicly traded cargo carriers’ earnings increased in the first half of 2017. Adjusted pretax profits grew 22.4 percent, from $5.5 billion during the first half of 2016 to $6.7 billion for the same period in 2017. FedEx accounted for most of the increase, as FedEx’s pretax profits grew nearly $1.1 billion. Revenues for these carriers increased 12.3 percent from $56.7 billion to $63.6 billion during the same period. As a result, total pretax margin for cargo carriers rose from 9.7 percent in the first half of 2016 to 10.5 percent in the first half of 2017 (see Figure 13).
Two divergent views currently exist regarding the near-term outlook for cargo. One school of thought believes that air freight demand will drop off as the recent uptick in cargo traffic has met the inventory requirements for the upcoming peak shipping season. In addition, the prospect of countries turning toward more inward-looking and protectionist trade policies could put a further damper on the cargo industry. The other viewpoint believes that growth has gained momentum and will continue into the peak season. Surveys indicate that business leaders have become more optimistic about future prospects. These leaders see the global economy experiencing renewed optimism and stronger growth. This optimism is fueled by expectations of continued fiscal support in China and the continued loose monetary policy in the United States. Furthermore, as ecommerce continues to expand and redefine itself, it presents more opportunities for freight operators as a result of real-time delivery solutions.
While the expansion of e-commerce presents opportunities for freight operators, it also presents a challenge. As Amazon begins to build its own domestic air network, it’s beginning to shift its freight business away from FedEx and UPS and onto planes operated by ATSG and Atlas. While the current plan is for 40 aircraft (20 each to be operated by ATSG and Atlas), the hub Amazon is building at Cincinnati/Northern Kentucky International Airport will support a fleet of 100 cargo planes.
FFD sector continues to shrink
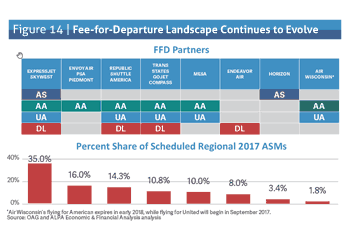
The fee-for-departure (FFD) industry continues to face challenges that are the direct result of that sector’s unique business model. The sector has recently increased the transfer of flying obligations among FFD carriers via contract extensions, realignments, and discontinuation of certain capacity purchase agreements with mainline carriers (see Figure 14). Air Wisconsin announced a new five-year capacity purchase agreement with United Airlines, transitioning away from a 12-year partnership with American Airlines. ExpressJet, a wholly owned subsidiary of SkyWest, Inc., realigned its capacity purchase agreement with United Airlines with a new five-year extension, and is also winding down its agreement with Delta Air Lines, with most of the 76-seat CRJ900s transferred to Endeavor Air, a wholly owned subsidiary of Delta. Although these new agreements still do not give the FFD carriers the ability to increase the revenue negotiated for the duration of these long-term agreements and continue to place pressure to limit cost increases, they do provide more structural stability and a more clearly defined long-term strategy.
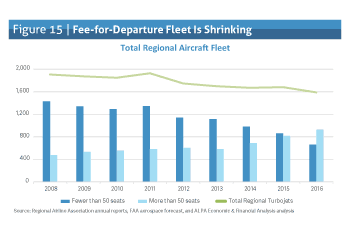
FFD carriers continue to favor 70-plus seat aircraft as they compete for even fewer contracts with the remaining dominant mainline carriers (see Figure 15). As a result, their capital costs have increased in the short term as they replace 50-seat jets with more fuel-efficient 70-seat jets. Based on FAA estimates, the FFD carrier fleet is forecast to decline by 14 percent between 2016 and 2025.
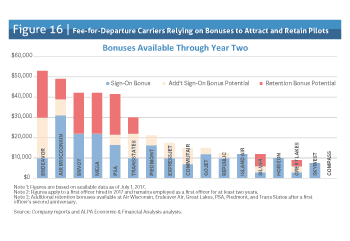
In addition to capital costs, labor costs at the FFD carriers are also increasing, as these carriers are making an effort to provide higher wages and benefits and more career-progression opportunities to pilots to combat attrition. Many of the FFD carriers have been forced to increase the amount of signing bonuses and retention payments being offered to attract and retain pilots and to remain competitive in the recruiting market (see Figure 16).
Furthermore, as part of the new capacity purchase agreements signed with mainline carriers, many FFD carriers have implemented career pathway programs that will give pilots access to jobs at larger mainline carriers if they meet specific hiring standards. While these wage and short-term and temporary bonus solutions certainly benefit prospective pilots, they don’t necessarily secure their long-term compensation and benefits packages nor do they solve the quality-of-life issues pilots are seeking to resolve at FFD carriers.
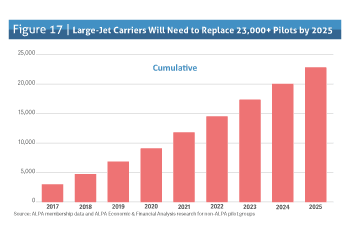
Pilot retention at FFD carriers will also be exacerbated as pilot retirements at the mainline carriers begin to significantly increase in 2021 and peak in 2025, with an estimated 23,000-plus pilots expected to retire between now and 2025 (see Figure 17). These retirements will have a negative impact at FFD carriers as FFD pilots transition to mainline flying.
Challenges in the FFD sector can’t be overcome by the managements of FFD carriers alone. Mainline carriers that extensively rely on the feed of these FFD carriers need to realize that they can’t continue to whipsaw FFD carriers against each other in a quest for the lowest cost, as this will exacerbate the problem the sector has in attracting and retaining pilots. And, ultimately, this will hurt mainline carriers, as a large portion of their pilot hiring pool comes from the FFD industry. Collaboration by both partners will contribute to the growth of the U.S. airline industry as well as help secure the long-term development of the piloting profession.
Outlook for the remainder of 2017
The U.S. mainline passenger industry has posted seven straight years of profits and remains on track for an eighth consecutive year of profitability. However, it’s expected that the profit levels achieved this year will be lower than 2016 levels, even before taking into account the impact of Hurricanes Harvey, Irma, and Maria.
Even prior to the recent hurricanes, fuel prices had increased. Between July 3 and August 23, jet fuel prices had risen by about 15 percent.
Airlines had also started to reduce revenue expectations, citing close-in domestic yield pressures and increased competition, in some cases resulting in fare wars.
The industry continues to be challenged by outside forces, such as government regulation and taxation, increased international competition from subsidized carriers, and emerging business models, such as the recent rise of long-haul low-cost competition across the Atlantic Ocean.
While FFD carriers are affected by some of these challenges as well, their most immediate test is attracting and retaining pilots.
For the freight carriers, while the start of this year has been promising, the outlook for the rest of the year is a bit mixed. Although the export order books are growing, capacity growth has outpaced traffic growth in the past few months. This decrease in load factor will put pressure on yields.
ALPA’s Economic & Financial Analysis Department will continue to track and examine the various economic and financial indicators that impact the airline industry, as these factors play a crucial role in the career of the Association’s members and the overall airline piloting profession.