Release #: Vol. 84, No. 8
October 01, 2015
North American Airline Industry Continues on Profitable Path, but Threats Persist
By ALPA Economic & Financial Analysis Department Staff
Economic factors
Economic growth during 2015 has been anemic at best. In fact, gross domestic product (GDP) growth projections, on a global scale, continue to be constantly revised downward (Figure 1). Recent headlines regarding the strength of the U.S. dollar, the devaluation of China’s yuan and other currencies, a potential interest rate increase, and slumping oil prices are having a negative effect on the industry.
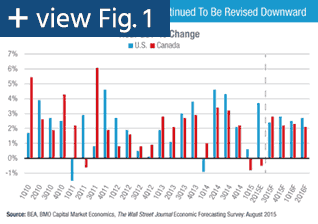
The latest estimates place 2015 economic growth for the world, the U.S., and Canada at 3.3 percent, 2.5 percent, and 1.5 percent, respectively. These projections may be further revised downward as a result of stock market volatility and a potential increase in U.S. interest rates by the Federal Reserve. In fact, the Canadian economy shrank the first two quarters of this year. A weaker economy does affect consumer sentiment, which, in turn, affects consumers’ willingness and ability to purchase goods and services, including air travel.
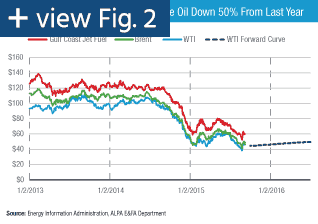
Economic growth is a key driver for the industry, but the price of oil also has a significant effect on the financial results the industry expects. West Texas Intermediate (WTI) crude oil prices have declined approximately 50 percent from 2014 levels (Figure 2). Recent economic upheaval has caused oil prices to temporarily drop below $40 a barrel, a rate not seen in more than 10 years. Lower crude oil prices result in lower jet fuel prices. U.S. airlines saved nearly $6.7 billion in fuel expenses during the first half of 2015. As oversupply from OPEC countries continues, it’s expected that crude oil prices will remain depressed for at least another six months.
As stakeholders in the airline industry, ALPA welcomes the reduction in oil prices. However, from a more macro-economic point of view, the decline in oil prices symbolizes a weak economy as well as a drop in corporate profits for a major industrial sector, further pressuring overall economic growth. In fact, the industry is seeing a downturn in demand for travel to oil-producing regions both globally and domestically.
Mainline carriers report strong performance
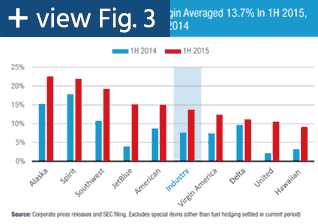
In the first half of 2015, U.S. mainline carriers were able to report some of the strongest profit margins of this current up cycle. The industry averaged a 13.7 pre-tax profit, nearly double the performance of the first half of 2014 (Figure 3). However, without the relief from lower fuel prices, second-quarter results could have been dramatically different.
 North American Airline Industry Continues on Profitable Path, but Threats Persist
Airline industry headlines for the first half of 2015 highlighted record profits and a renewed focus on capacity discipline leading to continued financial improvements. This is certainly good news for all industry stakeholders as industry executives look for sustainable growth, shareholders are earning increased returns on their investment, and employees are looking to improve their wages and benefits. So is the industry on a long-term “up” cycle?
In this industry, it’s important not to just assume the answer is “yes.” Instead, it’s necessary to delve deeper into the details of the results. In doing so, it becomes clear that the answer is not simple, as industry results are not consistent by sector, and various macroeconomic factors highlight some industry challenges. In short, the results are mixed: U.S. mainline carriers, despite a weak revenue environment, did generate record profits thanks to lower jet fuel prices. The U.S. regional industry continues to face significant challenges. The U.S. cargo sector is on a very slow recovery path. Canadian carriers continue to face their own unique challenges.
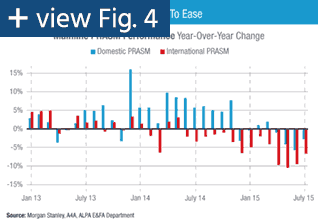 Since late 2014, passenger revenue per available seat mile (PRASM) has declined on a year-over-year basis (Figure 4). For the U.S. mainline industry, PRASM was down 3.7 percent from a year ago. Because the global economy continues to remain weak, PRASM on international routes has steeply declined, further lowering overall yields. This drop in total PRASM cost the U.S. industry more than $2 billion in revenue during the first half of 2015. PRASM for U.S. airlines is expected to remain weak into early 2016. The declining Australian dollar, Brazilian real, and Mexican peso may further affect international PRASM. In addition to a weak economy, capacity plans that airlines have in place are also affecting PRASM levels.
When airlines were first developing capacity plans for 2015, economic demand was projected to be much stronger, and fuel prices were projected to be higher. As economic demand slipped and revenues dropped, many carriers opted not to revise capacity levels, since the drop in fuel prices was more than offsetting the drop in revenue. Given the continued meek economic growth, some carriers have recently revised their growth plans downward. However, now that the price of fuel is expected to remain low well into 2016, the industry is concerned that capacity levels will continue to grow. This growth, in the face of slow economic demand, will place further pressure on pricing and yields.
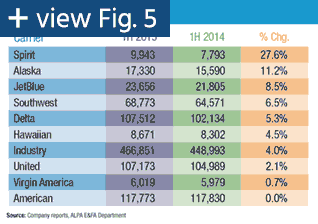
Capacity for U.S. mainline carriers was up 4 percent in the first half of the year, with domestic capacity up 4.6 percent, transatlantic capacity up 0.2 percent, Latin capacity up 5.9 percent, and transpacific capacity up 3.6 percent (Figure 5).
While mainline airlines foresee continued profits, the sector’s revenue performance will continue to be challenged by anemic economic growth in North America, weak economies around the world (particularly in China and Brazil), foreign exchange issues, and other geopolitical concerns. While low fuel costs will help offset the drop in revenue, airlines will continue to focus strongly on nonfuel costs as well.
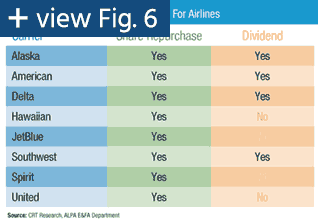
In addition, since providing increased returns to shareholders has become a primary focus of U.S. mainline carriers, those returns will likely not be diminished in the near future. Almost every mainline carrier has a share repurchase program in place, with many now paying dividends as well (Figure 6).
Fee-for-departure sector continues to struggle
The fee-for-departure (FFD) sector of the U.S. airline industry continues to be negatively affected by a variety of factors.
- While mainline partners have been growing their own capacity, they have actually removed capacity from FFD carriers.
- New flying has been awarded in a heavily competitive environment, and any additional flying that may be awarded will largely be more a result of expiring capacity-purchase agreements at certain airlines or at airlines not able to complete their service agreements.
- Competition for flying is further affected as wholly owned carriers do not have a profit incentive, unlike other carriers.
- Total fleet count is decreasing as carriers continue to eliminate 50-seat aircraft in favor of larger 76-seat jet aircraft (larger aircraft, fewer hulls).
- Some FFD airlines have the additional burden of aircraft ownership/lease costs, while at others those costs are borne by the mainline partner.
- The pilot pay shortage in the FFD sector has affected hiring and retention.
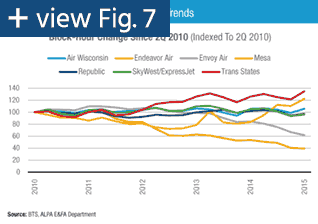
- A wide disparity in block-hour costs exists among FFD airlines, largely influenced by longevity differences at some carriers (Figure 7).
With mainline carriers starting to hire pilots again, regional carriers need to replace those pilots moving to the majors. However, due to the low wages that some regional carriers are offering and the absence of a career path, FFD carriers are having a difficult time attracting and retaining pilots. In response, the regional industry is taking three different approaches to this problem:
- Growing fleet size to reduce upgrade time, which Mesa and Trans States are doing.
- Shrinking in size to use the available pilots they have, which SkyWest, Endeavor Air, and Envoy Air are doing.
- Maintaining overall fleet count but upgauging (adjusting capacity by using larger airplanes on existing routes), which Republic is doing.
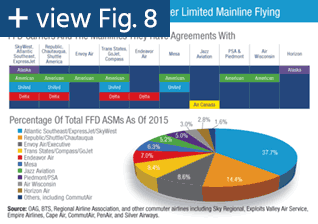
Those regional airlines that are growing their fleets and/or block hours have the most appeal to pilots. And many pilots find that the shorter time it takes to get pilot-in-command time required to be hired at the mainline carriers is a better selling point than receiving a signing bonus from a regional carrier. Regardless of how each regional carrier decides to handle the pilot shortage, they are all competing for a shrinking pool of mainline flying (Figure 8). While some regional airlines are facing more serious problems than others right now, eventually they may all face the same reality because an airline can’t shrink forever, nor can it grow indefinitely.
Cargo sector slowly rebuilding
The U.S. air freight business has undergone significant change since the 2008–2009 recession. Air freight has actually lost ground to ocean freight as the “market share” of air freight has dropped from approximately 3 percent of total international containerized trade in 2000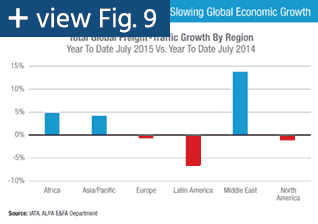 to approximately 1.7 percent in 2013. Since 1989, the annual growth for air traffic has averaged 5.2 percent. However, with slowing world trade, annual growth has averaged only 2.5 percent in the last 10 years (Figure 9). Additionally, the cargo business is relying more on, and seeing more competition from, widebody belly space in passenger aircraft.
The outlook for air cargo was positive in early 2015, especially for North American carriers. Increased demand was seen as shippers switched modes in response to the West Coast sea port congestion. Now with the sea ports running again, demand for air freight has tapered off. Even though economic performance was expected to pick up in the second quarter of 2015, no significant changes to freight demand are expected.
Coupled with trade declines resulting from weaker global growth is a focal shift in certain economies. China is focusing on its domestic market, thereby reducing its reliance on exports. Meanwhile, the U.S. is increasingly supporting its own manufacturing sector, thereby reducing its need for imports. 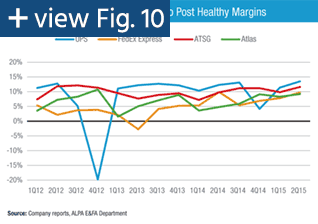 Trade to and from Central and Eastern Europe has strongly declined over recent months, a result of a notable slowdown in several economies in the region, including Bulgaria, the Czech Republic, Hungary, Poland, Romania, and Slovakia. In contrast, freight carriers in the Middle East are growing.
With regard to individual carrier performance, U.S. freight carriers continue to post positive margins (Figure 10), although not much year-over-year growth. The air cargo industry hasn’t enjoyed the same benefit from lower fuel prices as the passenger industry, mainly because freight carriers typically charge fuel surcharges.
Canadian carriers face varied challenges
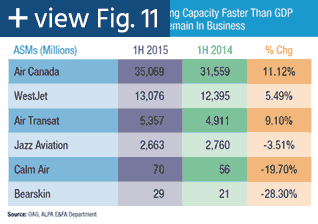
The larger Canadian network carriers, along with Jazz Aviation, continue to benefit from low fuel prices, cost control, and reasonable demand trends (Figure 11). However, similar to U.S. airlines, the two main Canadian airlines are encountering pressure on unit revenues and yields as industry capacity increases.
Capacity growth in the domestic Canadian airline industry has outpaced the Canadian GDP for more than a year. In fact, the Canadian economy officially slipped into a recession during the first half of 2015 as the GDP declined for two quarters in a row. Typically two quarters of declining GDP would be associated with a recession. However, the weakness can mostly be attributed to reduced business investment in Canada’s energy sector. Despite that industry’s declines, consumer consumption remains healthy. It’s expected that Canada’s GDP will rebound in the second half of 2015 due to increases in the automotive manufacturing sector and the strengthening U.S. economy. Weaker currency should also fuel an increase in demand for Canadian exports.
Specialty charter carriers that serve particular markets, such as the oil sands in Alberta, are being negatively affected by low fuel costs as business layoffs occur in the region. Further, the Canadian market is heavily competitive, and that competition makes it more challenging as certain carriers are losing business or exiting the market altogether.
Industry continues to be cyclical
Despite the last several years of economic growth and profits in the North American airline industry, a closer look at historical results clearly illustrates the cyclical nature of the industry (Figure 12). Historically, there has been a lag between when economic growth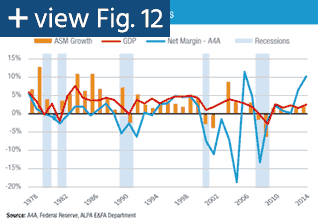 starts to decline and when airline traffic also declines. That lag has been as much as a year. The industry may be in that position now. However, this doesn’t necessarily mean that the cycle will be as negative as it was in 2008 and 2009, as mainline carriers are in a stronger position with better balance sheets, have instituted a capacity discipline strategy that’s been working (but may be going slightly off course), and have the added benefit of lower fuel costs.
Unfortunately, the entire North American airline industry isn’t reaping these benefits. The FFD sector continues to face challenges. Some FFD carriers are generating razor-thin profit margins and struggling to hire and retain pilots while trying to compete for flying where block-hour costs can be a determining factor.
The cargo industry continues to see anemic growth and economic challenges. Only the large carriers that deliver competitive products that satisfy changing customer demands continue to be profitable.
The International Air Transport Association recently reported that for the first time the global airline industry will earn a 7.5 percent return on its cost of capital in 2015. In most other industries, earning the cost of capital is a minimal business expectation, but not so in the airline industry. Continuing to earn this return will be paramount to the industry meeting the expected traffic demand increase coming in the next two decades.
The next several months will determine whether economic growth has peaked and whether the airline industry may be headed for a dip in the cycle or an extension. And, of course, that cycle can always be affected by an unforeseen event.
-###-

